The DODO Dashboard is an invaluable resource for participants in the decentralized finance (DeFi) space, offering a centralized platform to access, analyze, and interpret critical data related to trading, liquidity provision, and market trends within the DODO ecosystem. Powered by Subgraph, the DODO Dashboard harnesses the power of blockchain technology to aggregate and present real-time insights, empowering users and investors with the information they need to make informed decisions and navigate the dynamic landscape of decentralized finance effectively.
Starting Out on the DODO Dashboard
Navigating the DODO Dashboard effectively begins with understanding its key features and functionalities. Each section offers detailed insights into different aspects of the DODO ecosystem, allowing users to customize their data views, explore historical trends, and monitor real-time market activity.
- Navigate to the DODO Dashboard at https://info.dodoex.io/. Make sure you have the right URL.

2. You can expand any graph on the Dashboard by clicking the four arrows icon at the top right corner of the graph. The expanded form will look like this:

3. You can also narrow down the data by chain by selecting your desired chains from the drop-down menu beside “Key Metrics”.

Exploring Key Metrics
One of the standout features of the DODO Dashboard is its presentation of key metrics derived from Subgraph data. These metrics provide users with a comprehensive overview of the health and activity within the DODO ecosystem. For instance, the trading volume metric tracks daily trading volumes for each token and trading pair, offering valuable insights into market activity and liquidity dynamics.
Market capitalization, another critical metric, is calculated based on base pools’ reserves, token prices, and overall asset distribution within the DODO ecosystem. This metric helps users gauge DODO’s market value and assess the distribution of assets across different pools and pairs.
Additionally, the DODO Dashboard tracks the number of user addresses, transactions, smart contract pools, and pairs, providing valuable information on user engagement, platform adoption, and liquidity provision trends. These metrics collectively paint a vivid picture of DODO’s growth trajectory, network activity, and ecosystem expansion over time.
Supported Token Pairs
On the menu bar on the left side of the screen, you will see tabs called “Top Pairs” and “All Pairs”. These pages offer users visibility into supported token pairs, encompassing both DODO-exclusive trades and external pool transactions.
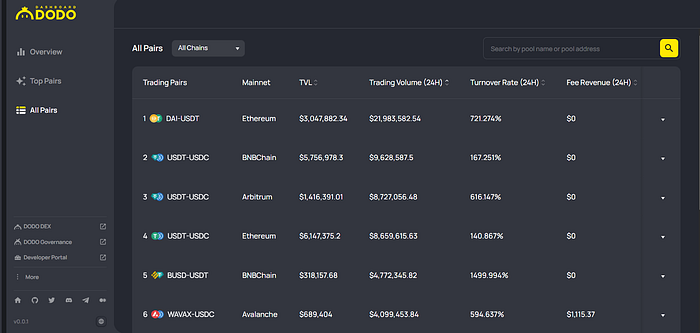
Users can analyze various metrics such as change ratios, turnover rates, and price charts for different token pairs, enabling them to identify optimal trading opportunities and assess market liquidity conditions accurately. The availability of comprehensive price charts, sourced from reputable third-party platforms like Coingecko, further enhances users’ ability to track and analyze token pair price changes over time.
Conclusion
In conclusion, the DODO Dashboard serves as a centralized hub for accessing crucial data and insights within the DODO ecosystem. By leveraging Subgraph data and advanced analytics, users can gain a deeper understanding of market dynamics, liquidity trends, and trading behavior. The dashboard’s user-friendly interface, coupled with comprehensive metrics and real-time updates, empowers users and investors to make informed decisions and navigate the evolving landscape of decentralized finance with confidence. As DeFi continues to evolve, platforms like the DODO Dashboard play a crucial role in providing users with the tools and information they need to succeed in this rapidly growing ecosystem.